The Weibull distribution is popular among some engineers for analysis of fatigue data and for failure prediction. The lognormal and not the Weibull distribution is used here to develop the system probability predictions for two reasons.
|
1 |
Fatigue associated with welds is much more likely to be a question of crack growth rate than time to crack initiation as is the case with hardened & ground smooth steel specimens.
|
|
2 |
The mathematics of the lognormal distribution are more easily grasped by most engineers. |
However, the system behavior predicted using lognormal statistics is not lognormal and it may be that approximation as a weibull distribution for the system behavior provides reasonable accuracy. Tests of those predictions are easily performed using the weibull model. The difference between this presentation and weibull analysis being that predictions of the mean and standard deviation of the log of life are combined with the stress analysis results and and s-n relationships to predict the weibull beta rather than using a weibull beta database for the system behavior, which would be entirely inappropriate for this type of evaluation. We are still evaluating the accuracy prospects of this step.
In a machine or weldment with numerous joints that is balanced in design (all joints are in the same ballpark with respect to resistance to failure), the statistics get interesting and fatigue test design becomes more challenging. Estimating the true life distribution of a single failure mode may require a sample size of unpractical proportions. The life distribution of the system can be estimated based on the estimated life distributions of all of the failure modes, and that distribution can be tested.
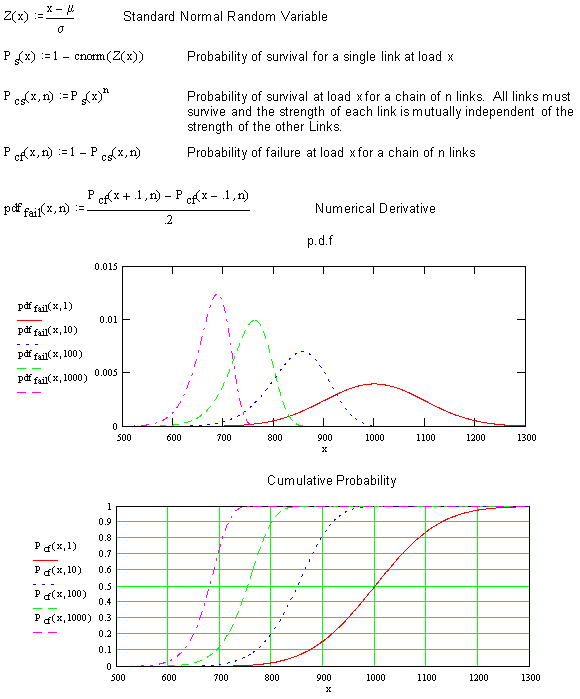
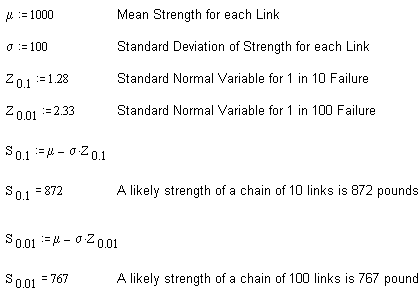
First, a warmer-upper. Say a chain is made of links whose strengths are normally distributed (not realistic, but this is an illustration) with a mean strength of 1000 pounds and a standard deviation of 100 pounds. What will be the distribution of strengths of a chain of 10 links or 100 links? Will that strength also be normally distributed?
With the old eyeball, you can say that a ten link chain will most likely have the strength of the weakest 1 of 10 links, a 100 link chain will likely have the strength of the weakest link in 100 links. Using standard normal statistics, this can be put mathematically as:
What does the distribution look like? Are the chances of failure of a 10 link chain at 872 pounds 50/50?
Observe that the probability density functions (p.d.f.'s) are skewed for all but a single link. While 767 pounds may be near the most likely single value for the strength of a 100 link chain, the median strength will be 754 and the mean strength will be approximately 749 lb. The good news is that the variance decreases as the number of links increases. The chances of having a 10 link chain survive 1000 pounds is the same as the chances of flipping heads ten times in a row (1 in 1024), starting on the first throw.
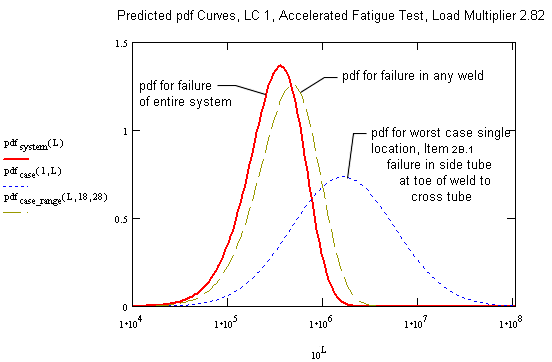
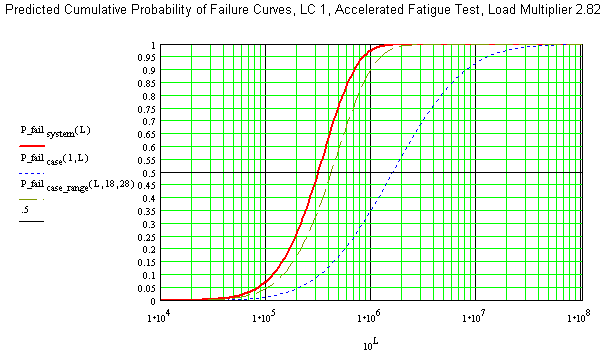
For the structure presented in the accelerated fatigue sample, there are 53 possible failure locations in the analysis, with varying mean log lives and variang standard deviation of the log of life. Assuming that the first local failure constitutes the end of the life (as with a chain), then the statistics of the intersection of mutually independent events may be used to calculate the system survival distribution as the intersection of the survival distributions of each possible failure location. That is for a system on n possible failure locations to survive a given number of cycles, each of the n locations must survive.
The probability of survival at each life over an appropriate range of lives for each possible failure location as standard normal variables from the calculated mean and standard deviation of the log of life at the test load can be combined to obtain the probability of survival for the system over the range of lives. From the probability of survival, the probability of failure can be calculated.
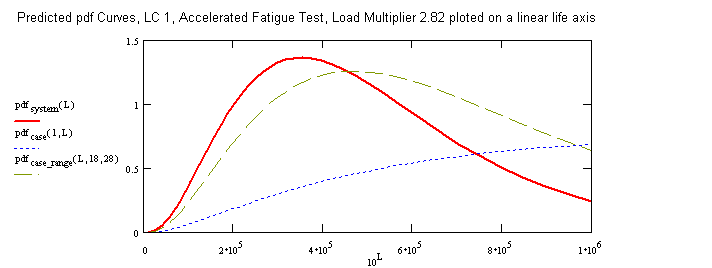
From the probability of failure over the range of lives, the probability density function (p.d.f.) can be be calculated numerically as the derivative of the probability of failure with respect to life over the life range. This is easily implemented in Mathcad or Excel.
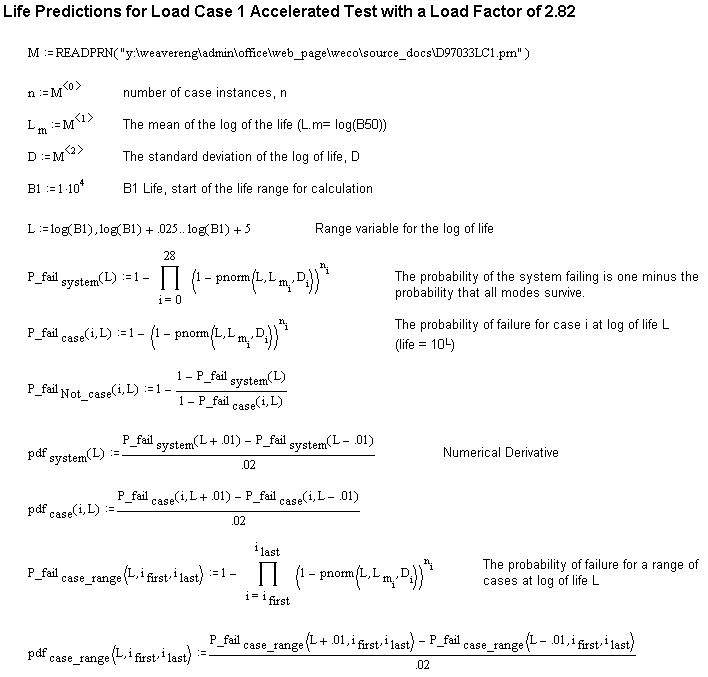
Observe that the predicted B5, B50, and B95 lives for the system at the accelerated test load are 8.35x10⁴, 3.12x10⁵, and 8.3x10⁵ cycles respectively. The mean time to failure (MTTF), obtained by taking the first area moment of the system failure p.d.f curve (the area under which is 1), is predicted to be 3.66x10⁵ cycles.
Now, we have some information to use as we think about designing a fatigue test:
Without a very large sample size, we are unlikely to validate the fatigue life distribution of individual details. In the above example, the most likely detail to fail is predicted to fail on about one in six samples. The remaing failures are predicted to be sprinkled over other locations. If a large sample is not practical, we can design the test to evaluate the validity of the distribution of the system life distribution that we have predicted.
The dispersion of life to failure is much less for the system than for individual components. This is desirable especially from the standpoint of design validation where the area of concern is the lower tail (B5, B1, etc).
The system p.d.f. resembles a high beta weibull p.d.f. One possibility to expedite the test evaluation is to use the system curve as calculated to estimate the weibull parameters and use standard weibull or weibayes statistics for the results evaluation. We would like to pursue this but have not yet done so. Please email us on this if you have any comments.
There are several choices for the design of a test for the fatigue life of the system, depending on the confidence required, the economics of testing, and the economics of design changes. A small sample, zero failure or single failure test can be run as a one sided hypothesis test: The null hypothesis being that the true life distribution (or B5 life or B1 life) is either the predicted distribution or exceeds the predicted distribution. The alternate hypothesis is that the true life distribution is shorter than predicted. Such a small sample test has the lowest testing cost and the highest probability of a type I error, that is, rejecting an acceptable design for a given confidence level. Larger samples and tests to failure will increase the accuracy of the test.
Conservative allowance for the true population variance must be made for designs where the area of interest is the lower tail of the distribution (B5, B1, B0.001 etc.), whereas, for other designs with only nuisance consequences of failure, the MTTF may be the only statistic of interest. We have yet to identify the equalivant of the Chi-Squared test for this model we have built, however, using the chi-squared test for the results would be unconservative for accepting the lower tail because of the direction that the system curve is skewed (there is more variance at the lower tail than the upper tail for the predicted population distribution). Again, the high beta weibull model may provide useful predictions, it is skewed in the same direction as the system p.d.f.
The decision on sample size can be dynamic, based on the data from the early samples. This may not be palatable to some, but it is practical. In the example presented, if the first two of three failures occur early at the same location, it may be expidient to redesign that detail without further testing or in depth statistical analysis. Likewise, if the first three samples exceed the median meaningfully, confidence calculations can be performed and an informed decision about the likelyhood of accepting a bad design (a type II error) can be made. The most difficult testing situation is where the sample results are near the rejection point. The costs of additional testing on the chance that the true distribution is acceptable must be weighed against the costs or redesign and retesting.
Just for grins, below is a linear life (not log) plot of the weldment p.d.f. curves: